Learn more
The Hidden Math of ROI: Thinking Beyond Labor Savings in Advanced Manufacturing
Resources

The Hidden Math of ROI: Thinking Beyond Labor Savings in Advanced Manufacturing

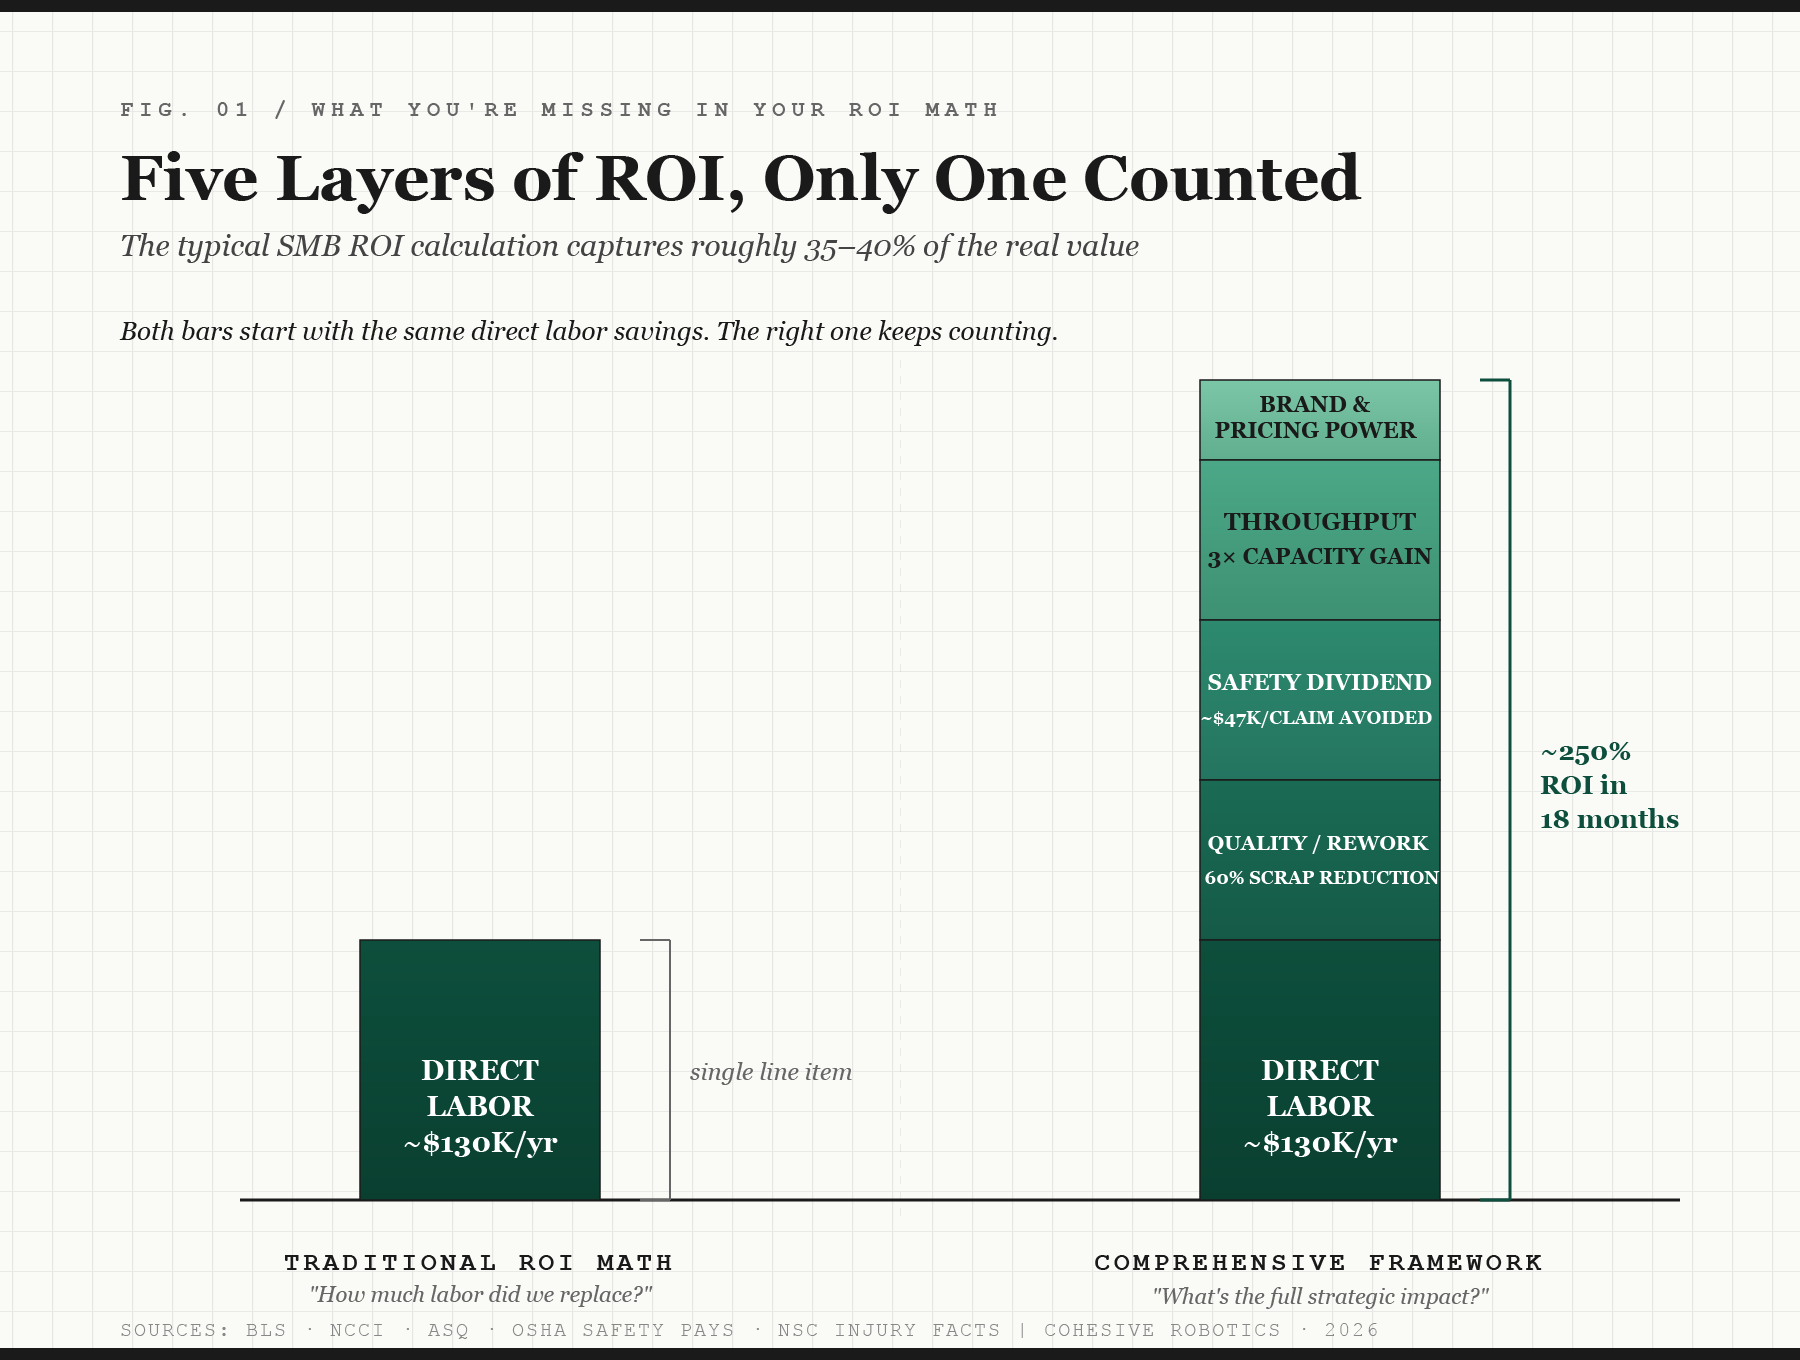
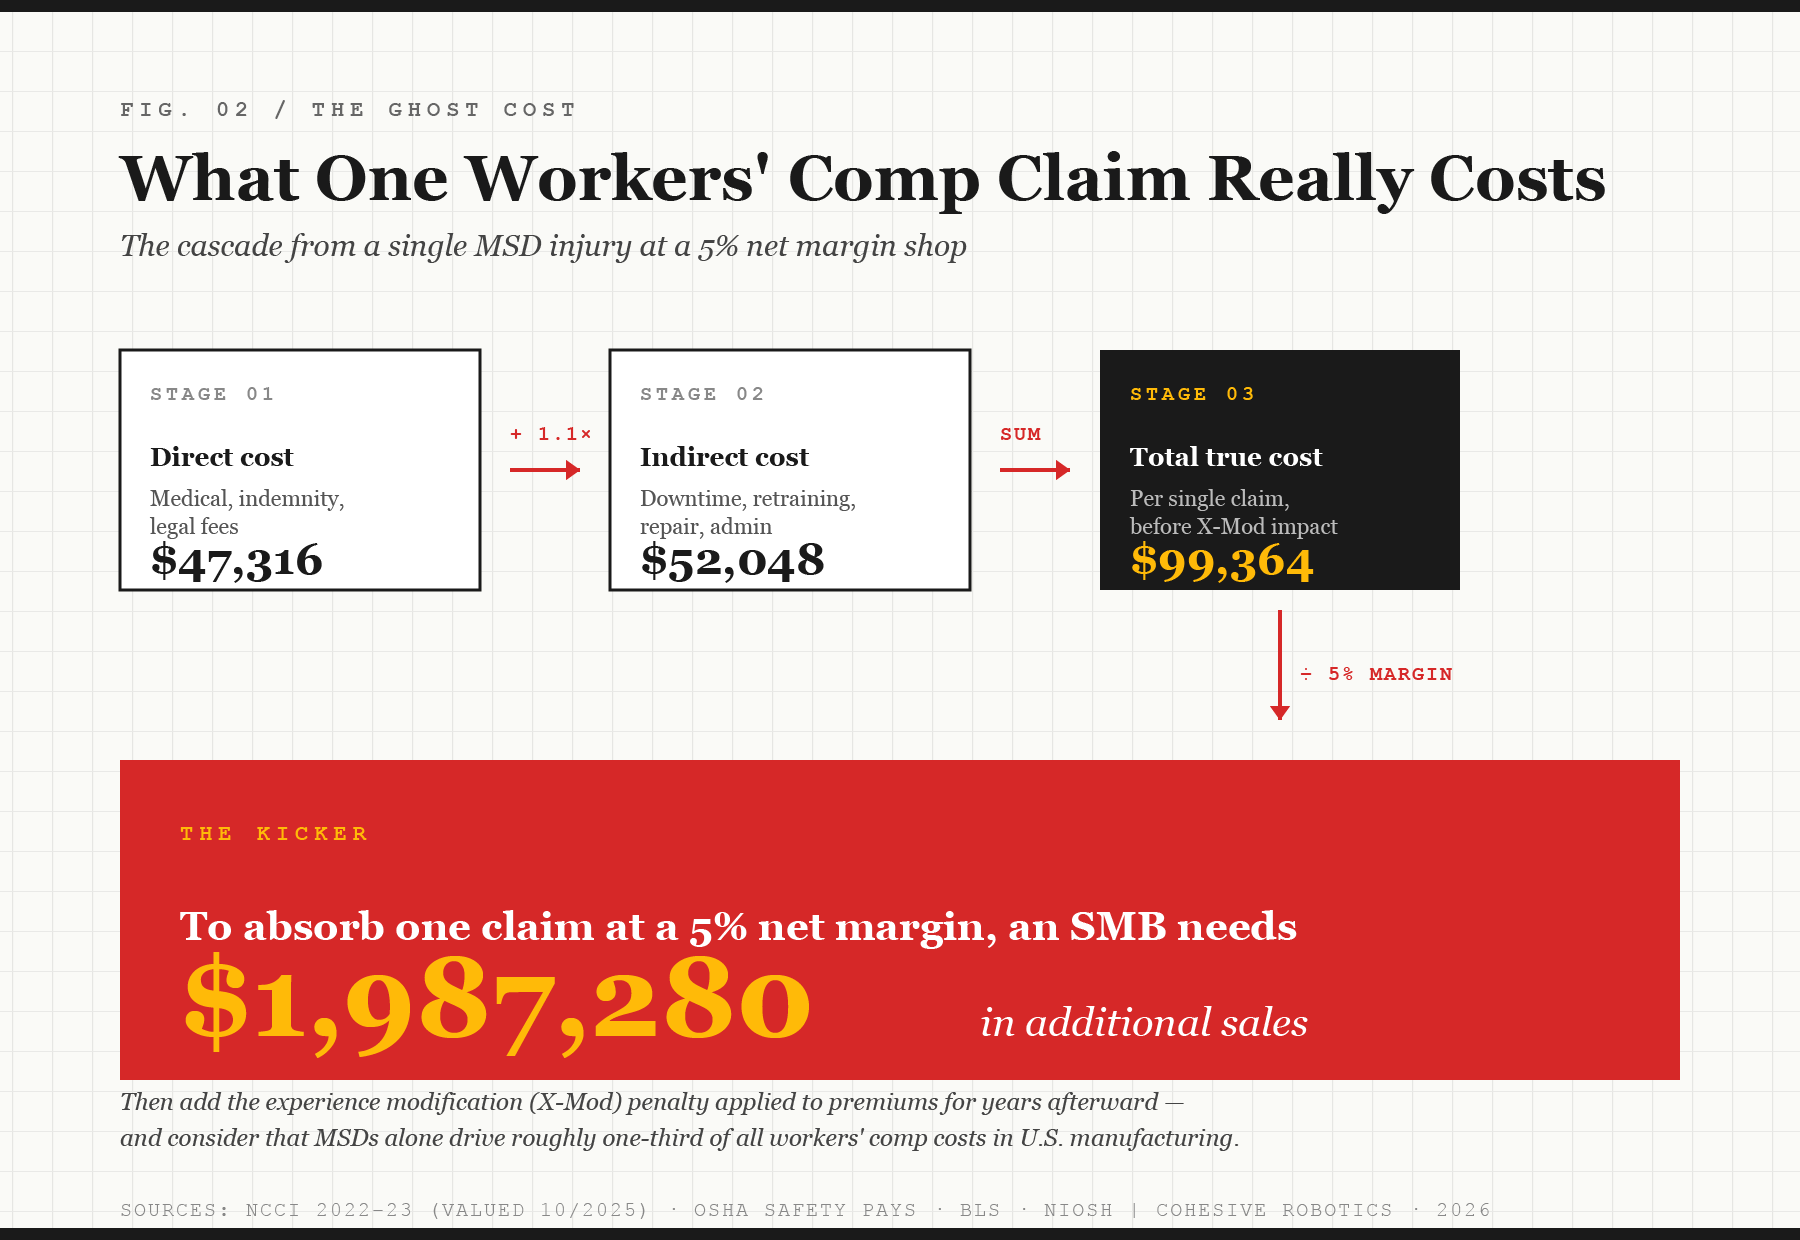
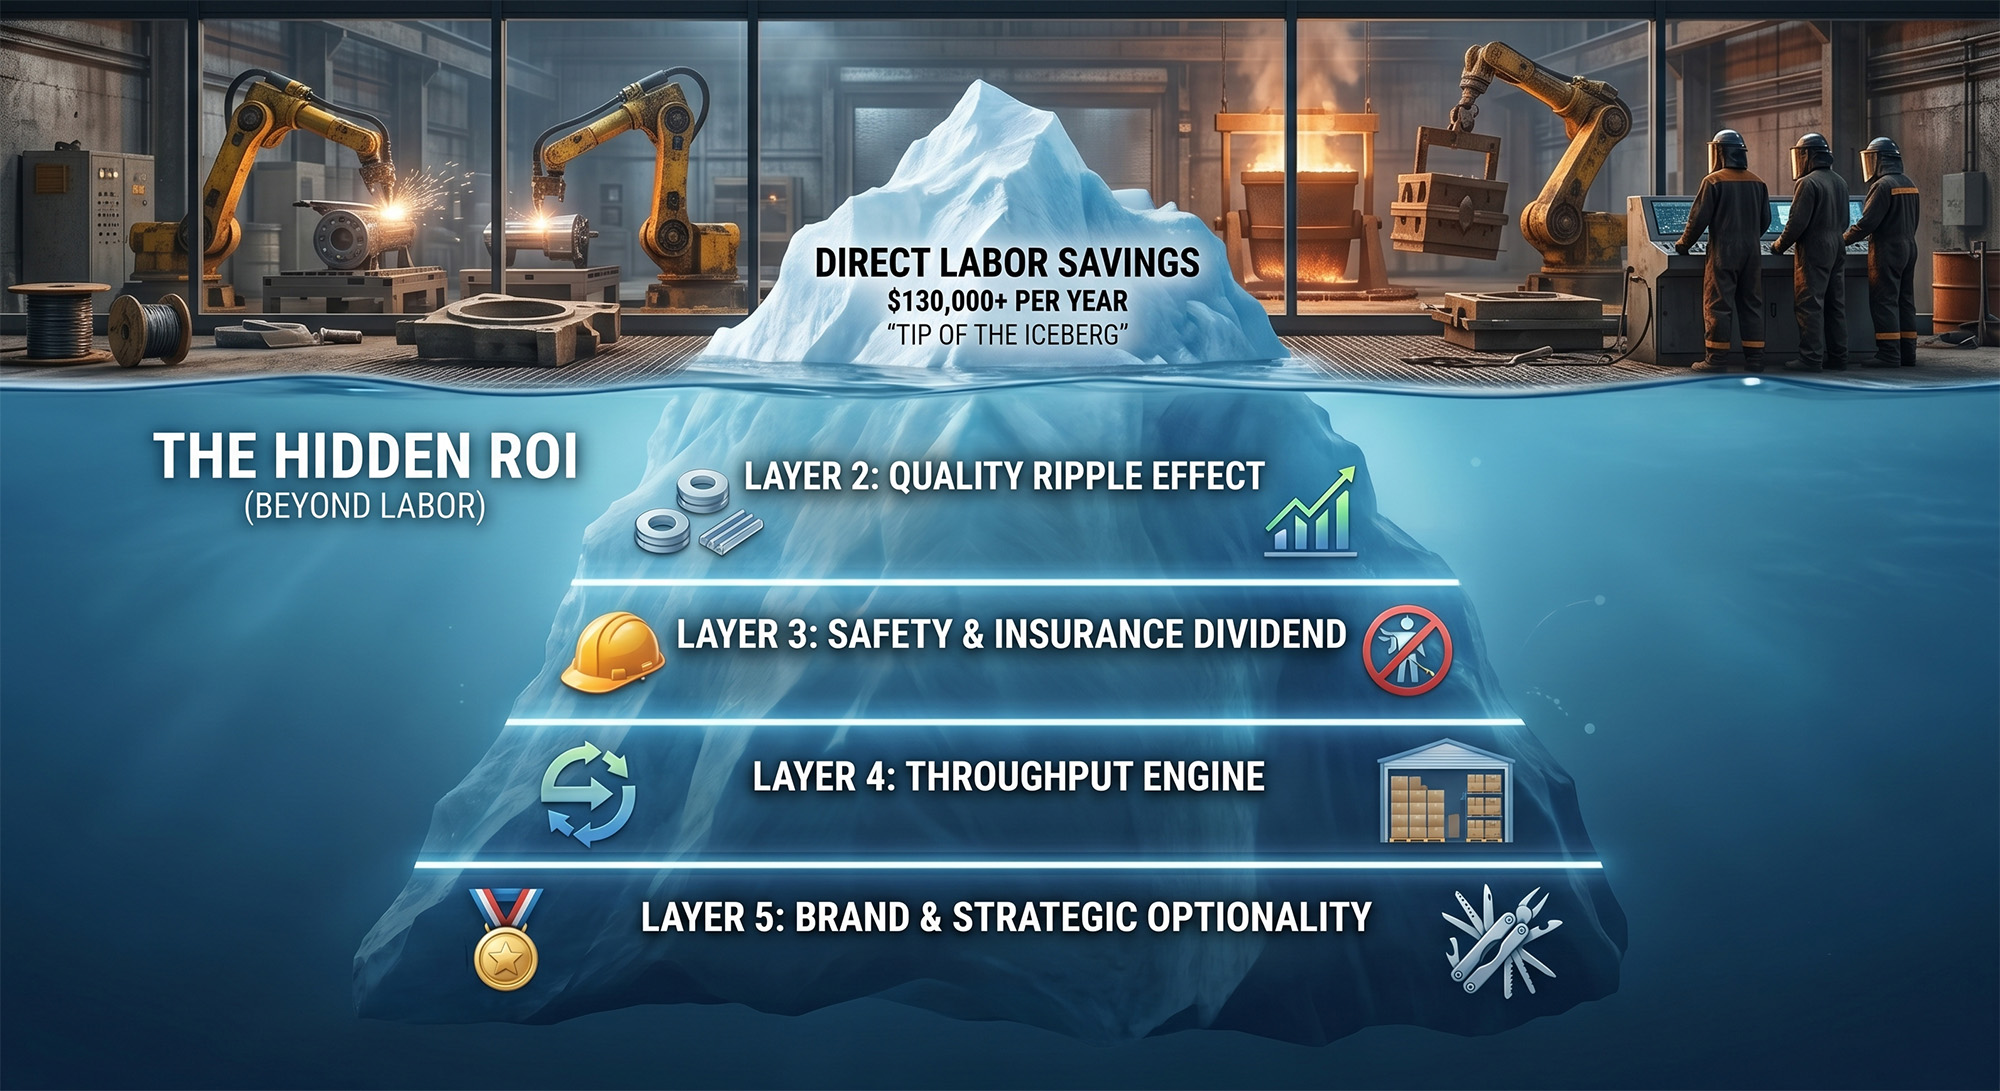
A serious manufacturing ROI framework in 2026 has to account for things beyond repurposing labor. There are four other layers that don't always show up on the standard ROI spreadsheet: quality, safety, throughput, and brand. Together, those layers routinely deliver more value than the labor line itself. This is the case for what we call the "Hidden ROI" — and why every manufacturing leader at SMBs evaluating a robotics investment needs to do the comprehensive math, not the convenient one.

June 11, 2026

When most small and medium-sized manufacturers calculate the return on a piece of automation equipment, they reach for the same single-line worksheet they've been using for decades: how many FTEs does it repurpose, how much do those hours cost, how many more parts can I make, when does the machine pay itself back. It's the math their finance team expects. It's the math the equipment salesperson plays along with. And in 2026, it's the math that systematically understates the value of advanced automation by roughly 50-60%.

Direct labor substitution is real, and for a single robotic finishing workcell it averages well north of $130,000 per year once you account for BLS-reported total compensation of $46.30 per hour worked in U.S. manufacturing, benefits, overtime premiums, and the cost of two shifts. But that line item is the tip of the ROI iceberg. A serious manufacturing ROI framework in 2026 has to account for four other layers that don't always show up on the standard ROI spreadsheet: quality, safety, throughput, and brand. Together, those layers routinely deliver more value than the labor line itself.

This is the case for what we call the "Hidden ROI" — and why every manufacturing leader at SMBs evaluating a robotics investment needs to do the comprehensive math, not the convenient one.

The same direct labor savings, two completely different ROI conclusions.

Layer 1: Direct Labor — Real, But Only Half the Story

Let's start by giving the traditional calculation its due. The U.S. is in a manufacturing labor crisis. There are roughly 600,000 unfilled manufacturing jobs today, projected to climb to 2.1 million by 2030. Welders, cutters, solderers, and brazers earn a median annual wage of $51,000, with another ~45,600 openings projected every year of the next decade — most of them just to replace workers who retire or leave the trade.

Automating a single sanding, deburring, or finishing station — running two shifts at roughly $25/hour fully loaded — comfortably saves $130K+ per year in labor alone before you even factor in recruiting costs, training time, and the ~40% first-year attrition rate common in physically demanding manufacturing roles.

This is the calculation 90% of SMBs stop at. It's also why most of them underbuy, postpone, or talk themselves out of automation that would have transformed their P&L.

Layer 2: The Quality Ripple Effect

The American Society for Quality has been making the same point for decades, and few SMBs act on it: the cost of poor quality (COPQ) in a typical manufacturer ranges from 5% to 30% of annual revenue, with 15-20% being the common band. For a $20M-revenue manufacturer, that's a $3M-$4M annual leak hiding inside scrap bins, rework stations, and customer returns.

Drill down further. Top-performing manufacturers spend 0.6% of revenue on scrap and rework alone; bottom performers spend 2.2%. That difference is often the entire net margin of a small fabricator.

Robotic finishing and welding systems achieve dramatic improvements here. For example, our customers running the Smart Finishing Robotic Workcell are seeing reductions in rework and scrap of up to 90%, with conservative averages around 60%. The ripple effects go further than the factory floor:

  • Reduced warranty and return costs. Fewer defects means fewer chargebacks, fewer field failures, and a lower Return Material Authorization rate — a quality KPI that increasingly drives prime-contractor scorecards in uptime-critical industries like aerospace and defense.
  • Brand equity and pricing power. When a shop can demonstrate consistent, repeatable finish quality across a high-mix order book, it earns the right to charge a premium for it. Customers don't pay for "we hit spec most of the time." They pay for "we hit spec every time."
  • First-Pass Yield gains. First-Pass Yield (FTT) — the percentage of parts that complete production without rework — is the single most under-measured leverage point in high-mix manufacturing. Automation and robotic systems will routinely help lift FTT by 10-20%.

These are not soft benefits. They are P&L line items that show up the moment they start to compound.

Layer 3: The Safety and Insurance Dividend

Of all the indirect benefits of automation, the one most consistently missed by SMB ROI math is what we call the safety dividend, or the long-tail value of preventing the injuries that would otherwise sit on the manufacturer's ledger as a "ghost cost."

The numbers are sobering. According to the National Council on Compensation Insurance (NCCI), the average cost of a workers' compensation claim for accidents occurring in 2022–2023 was $47,316, and the National Safety Council notes that claims now average close to $50,000. The Insureon manufacturing benchmark puts higher-risk metal fabrication and machinery shops at $2.00–$4.00 of workers' comp premium per $100 of payroll. For a shop with $2M in annual payroll, that's $40K–$80K in premium before you account for the experience modification ("X-Mod") factor that punishes claim history for years afterward.

The biggest single contributor to those claims is exactly the kind of work robots are best-suited to replace. Musculoskeletal disorders (MSDs) — repetitive-motion injuries, vibration injuries, lifting injuries, awkward-posture injuries — account for nearly one-third of all workers' compensation costs in the U.S. and roughly $20 billion per year in direct costs. The direct cost of a single MSD-related injury ranges from $15,000 to $85,000 per case — and the NIOSH-estimated indirect costs can run two to five times higher, with OSHA's own Safety Pays methodology applying a sliding-scale multiplier that ranges from 1.1x to 4.5x the direct cost.

Manual belt and stroke sanding. Repeated overhead grinding. Vibrating hand tools. Heavy-duty welding in awkward positions. These are the exact tasks that smart robotic workcells are designed to take over — and they are, not coincidentally, the exact tasks that drive MSD claims at various metal product manufacturers such as in building materials, machinery, and heavy equipment.

There is also a fatigue dimension that even the best human operator can't beat. Robot spatial precision and force control do not degrade across an 8-hour shift. There is no fatigue-induced moment of inattention in hour seven that puts a finger near a sanding belt. For a factory owner, every prevented MSD claim is the equivalent of generating roughly $2M in additional sales at a 5% net margin — just to break even on what didn't happen.

The real revenue impact of a single workers' compensation claim, using OSHA's Safety Pays methodology.

This is the workers comp savings category that almost no vendor will quantify for you on a quote — and the one with the largest single-event upside on the entire ROI sheet.

Layer 4: The Throughput Engine

The fourth layer is where the calculation flips from "cost reduction" to "revenue expansion." This is the part most SMB owners only fully appreciate after they've lived with automation for six months.

A human operator can sustainably work one shift, with breaks. A well-designed robotic workcell can run two or three shifts with a single tended changeover per shift. The math compounds: same fixed costs (rent, supervisor, IT, utilities), 2-3x the output. That's the basis of the "300%+ throughput" gain that the original framework references, and it shows up not as savings but as the ability to say yes to work you previously had to turn down.

For a contract manufacturer or high-mix OEM, "saying yes" to a new customer or a new production line is the single most valuable strategic asset there is because it converts under-utilized capital equipment into a higher revenue base without proportional new investment. Industry analyses suggest automation can reduce operational costs by 15–30% while cutting rework and scrap by 20–50%, with the throughput layer often being the largest single contributor in High-Mix Low-Volume (HMLV) environments.

Layer 5: Brand Equity and Future Optionality

Finally, there's a layer the spreadsheet can't easily capture but every factory operator intuitively understands: the strategic optionality automation creates.

A finishing department that runs predictably is a finishing department a customer can build a long-term relationship around. A factory floor with high-mix and higher-margin customization options that can take on unique low-volume work because its workcell reprograms in minutes — not days — is a factory that can pursue aerospace, medical, and architectural contracts that pure-manual competitors structurally can't bid on. A factory that can show real-time quality data to a Tier 1 customer's supplier scorecard is a factory that gets onto the approved-vendor list for the next program.

These are not vanity benefits. They are the deciding factor in which factories and contract manufacturers grow into $50M+ businesses over a decade and which ones plateau.

The Formula for 2026

Putting the five layers together: small manufacturers that adopt a comprehensive ROI framework — factoring direct labor, COPQ reduction, the safety and insurance dividend, throughput expansion, and brand equity — consistently report payback periods well inside 18 months and total returns in the 200–300% range over the first 24 months.

The traditional calculation looks like this:

ROI = (Annual Labor Savings × Years) / Capital Cost

The comprehensive calculation looks like this:

ROI = [(Annual Labor Savings) + (COPQ Reduction) + (Insurance & Claim Avoidance) + (Throughput Revenue Lift) + (Brand / Optionality Value)] × Years / (Capital Cost − Tax Incentives & Section 179 Recovery)

The second formula is harder. It requires you to actually quantify your current scrap rate, your workers' comp loss history, your X-Mod factor, your current rejected-quote rate due to capacity constraints, and the strategic value of new customer categories you can't yet serve. But it's the math that's actually true — and it's the math that turns automation from a cost-cutting tool into a strategic capability builder.

What This Means for SMB Decision-Makers

The most expensive mistake a smaller manufacturer can make in 2026 is not buying the wrong piece of automation. It's evaluating the right piece of automation with the wrong financial framework.

When you only count direct labor savings, you build a business case that's correct but radically incomplete — and you systematically underinvest. The factories that are pulling ahead right now are the ones whose owners learned to count the other four layers: the rework that didn't happen, the workers' comp claim that didn't materialize, the third shift that suddenly became economically viable, and the aerospace customer that came knocking because the quality data was finally there.

Direct labor savings will get the equipment in the door. The other four layers are what make the next decade of your business.

ABOUT THE AUTHOR

Enjoyed this read?

Stay up to date with the latest Cohesive Robotics news, automation strategies, and insights sent straight to your inbox!

Almost done! Check your email to verify signup.
Oops! Something went wrong. Please try again.